Monarch Money Reports: 5 Charts We Actually Use
The useful chart is not the prettiest one. It is the one that changes the next decision.
Monarch Money’s reports became useful when we stopped browsing and asked one question at a time. Five views—monthly spending, category trend, merchant totals, cash flow, and net worth—revealed $214 in quiet recurring costs, a 19% grocery drift, and a savings rate that looked healthier only after transfers were excluded.
During our June 24–August 4, 2026 Monarch Money test, reports were the feature most likely to look impressive and accomplish nothing. A colorful donut can describe last month perfectly without helping with this one. We therefore gave every chart a job: identify an unusual number, explain it, or confirm whether a change worked.
This guide reflects the report options and filters we used on August 3, 2026. Product labels can change. The figures below come from a sanitized test household and are examples, not suggested spending targets. Our full Monarch Money review covers connection accuracy, budgeting, collaboration, price, and its 4.8/5 score.
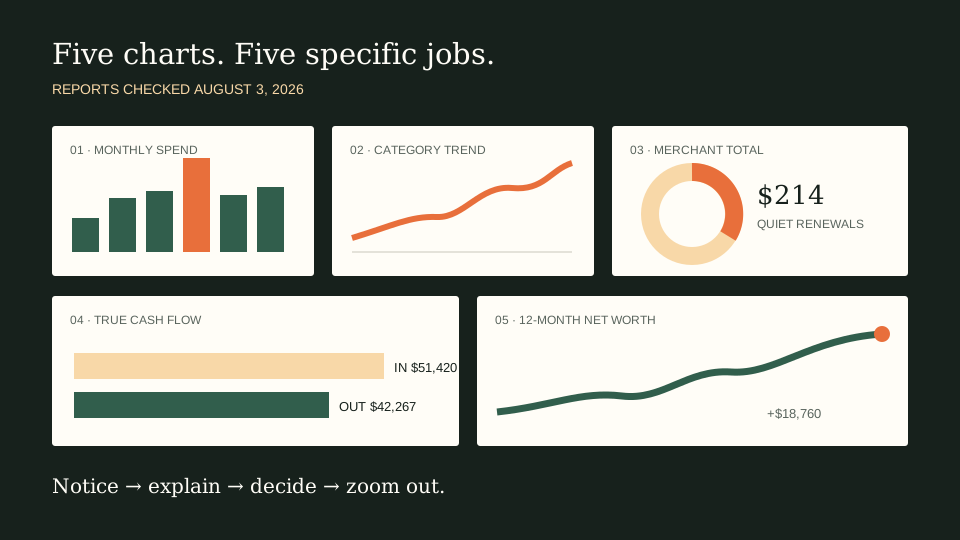
The five charts and their jobs
| Report | Filter | What it showed | Decision |
|---|---|---|---|
| Monthly spending | Last 6 months; exclude transfers | May was $486 above median | Inspect home and travel |
| Category trend | Groceries; monthly | $574 to $683 in 4 months | Set a $625 alert |
| Merchant totals | Recurring; year to date | $214 in low-use services | Cancel three renewals |
| Cash flow | Income and expenses; no transfers | 17.8% true savings rate | Automate $100 more |
| Net worth | 12 months; all assets and debts | Debt payoff drove 61% of gain | Keep payoff pace |
1. Monthly spending finds the odd month
We began with six monthly bars and excluded transfers, credit-card payments, investment purchases, and reimbursements. Without those exclusions, moving $2,000 from checking to savings looked like spending and made the report useless. The cleaned view showed May at $5,142, compared with a six-month median of $4,656.
The bar did not say why. That was fine. Its job was triage. Clicking May and grouping by category showed $312 of home supplies and $241 of travel above ordinary levels. Both were legitimate. We added a note rather than cutting June categories to “make up” for expenses that would not repeat.
2. Category trend catches slow drift
One large month attracts attention; a gradual rise often does not. The grocery line moved from $574 in February to $683 in May, a 19% increase. Transaction review found no single culprit. More convenience food and two extra midweek shops explained most of it.
We set a $625 flexible target and checked it weekly. June ended at $618. That did not prove a permanent change, but it gave the trend a decision. A report without a threshold had only been scenery.
3. Merchant totals make recurring costs concrete
We filtered January 1 through July 31, searched recurring transactions, and grouped by merchant. Three low-use services totaled $214: a fitness trial that had renewed, cloud storage duplicated elsewhere, and a publication no one remembered choosing. All were correctly categorized, so a category budget had hidden them among services we actively valued.
Merchant view also prevented indiscriminate cutting. The largest streaming total was used almost daily and stayed. The chart’s job was not to scold the tallest bar; it was to connect dollars with use.
4. Cash flow needs clean transfer rules
Our first cash-flow view suggested a 24.6% savings rate. It was wrong because a reimbursement appeared as income and a credit-card payment remained in expenses. After correcting both and excluding internal transfers, January–July income was $51,420 and true outflow was $42,267, leaving $9,153, or 17.8%.
That number supported a modest choice: raise an automatic savings transfer by $100 per month. We did not target 24.6%, because it had never existed. Reports reward careful categories, which is why our five-minute morning routine includes approving recent transactions.
5. Net worth shows what produced progress
The one-year line rose $18,760. Separating assets and liabilities showed that $11,440—61% of the improvement—came from lower debt rather than market growth or new cash. That distinction made the progress feel more durable and argued for keeping the current extra principal payment.
Net worth remains a broad measure. It can rise while checking cash becomes uncomfortably thin, and a home estimate can create apparent wealth that cannot pay a bill. We view it monthly, never as the first screen of the day. The LedgerLark glossary explains the relationship between net worth and cash flow.
A ten-minute reporting sequence
Once a month, we now open spending for six months, inspect any bar more than 10% from the median, open one drifting category, scan recurring merchants, validate cash flow exclusions, and finish with the 12-month net-worth line. The order matters. It moves from anomaly to cause to long-term direction.
Monarch’s filtering flexibility is a reason it beat Simplifi for our test household, though Simplifi remains quicker and cheaper. The Monarch versus Simplifi comparison scores both across seven practical categories. Whatever tool you use, save only views that answer a repeated question. Five charts with clear jobs beat a gallery of financial weather.
Monarch Money Reports FAQ
Which Monarch Money report should I check first?
Start with monthly spending over six months, excluding transfers and credit-card payments. It quickly identifies an unusual month that you can then inspect by category or merchant.
Why does cash flow look wrong in Monarch Money?
Transfers, reimbursements, duplicate transactions, or credit-card payments may be classified as income or spending. Correct those rules before treating the displayed savings rate as reliable.
How often should I check net worth?
Monthly is frequent enough for most households. Daily market movement can overwhelm the slower signals from saving and debt repayment, while a monthly view still catches meaningful direction.
Editorial note: This article reports a limited household test, not a universal spending rule. See how LedgerLark tests and edits.